In this comprehensive analysis, we evaluate the real estate markets across major global cities based on ten critical factors. These factors include price per square foot, average price change, total transactions, transaction volume change, rental yield, currency depreciation, taxation, infrastructure quality, political stability, and safety index. Our aim is to understand the attractiveness of various real estate markets and highlight why Dubai stands out as a prime investment destination.
1. Price Per Square Foot
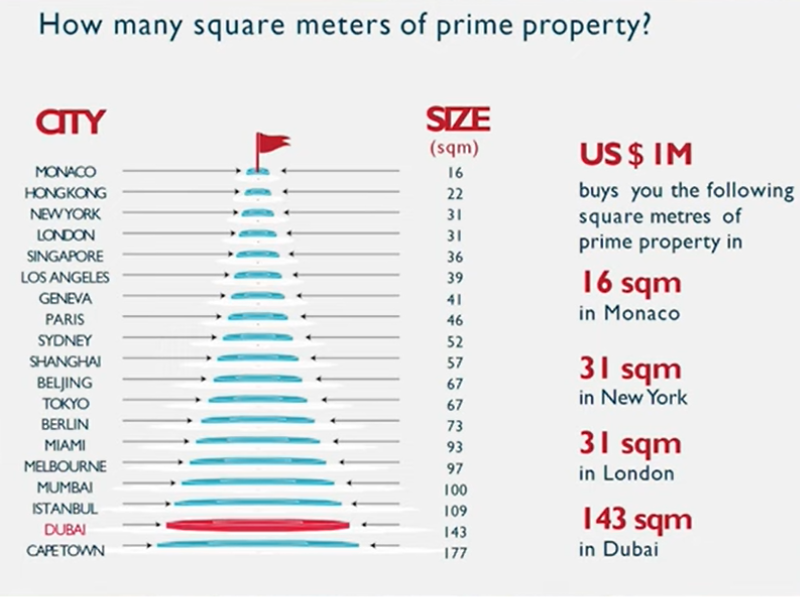
Monaco emerges as the leader in this comparison, boasting an average price of approximately AED 21,000 per square foot. This figure significantly surpasses the other cities on our list, indicating Monaco’s status as one of the most expensive real estate markets globally.
In stark contrast, Mumbai, India, represents the most affordable market in our analysis with an average price of AED 1,200 per square foot. This lower price point positions Mumbai as an attractive option for investors seeking value in a burgeoning market.
Here is a detailed breakdown of average real estate prices per square foot in the cities analyzed:
- Mumbai: AED 1,200
- Bangkok: AED 1,350
- Dubai: AED 1,400
- London: AED 3,000+
- New York: AED 3,000+
- Paris: AED 3,000+
- Toronto: AED 5,100
- Singapore: AED 6,250
- Hong Kong: AED 7,300
- Monaco: AED 21,000
2. Average Price Change
Analyzing the annual price change helps gauge market momentum:
- Dubai: +17.9%
- Monaco: +10%
- Mumbai: +7.5%
- Hong Kong: -13.3%
Insight: Dubai exhibits the highest annual growth rate, reflecting a robust and expanding market. In contrast, Hong Kong faces significant depreciation, highlighting a struggling market.
3. Total Transactions
Total transaction volume indicates market liquidity:
- Sydney: 115,000 transactions
- Dubai: 101,000 transactions
- Monaco: 416 transactions
Insight: Sydney leads with the highest transaction volume, suggesting a highly liquid market. Monaco’s minimal transactions align with its high-end, low-volume real estate market.
4. Transaction Volume Change
This metric reveals how transaction activity has evolved over the past year:
- Dubai: +32%
- New York: +18.2%
- Sydney: +14%
- London: -36%
Insight: Dubai stands out with the most substantial increase in transaction volumes, signaling a vibrant and growing market. London, conversely, has seen a drastic decline.
5. Average Gross Rental Yield
Rental yield measures the return on investment from rental income:
- Dubai: 8.5%
- Bangkok: 6%
- Sydney: 4.8%
- Monaco: 2%
Insight: Dubai offers the highest rental yield, making it an attractive market for rental income. Monaco’s low yield reflects its high property prices and limited rental returns.
6. Currency Depreciation vs. USD
This evaluates the stability of local currencies compared to the US Dollar:
- Dubai & Hong Kong: No change (pegged to USD)
- Singapore: -5%
- Sydney & Mumbai: -28.7% and -28.8%
Insight: Cities with currencies pegged to the USD, like Dubai, are shielded from currency depreciation. In contrast, cities with significant currency depreciation face potential erosion in investment value.
7. Taxes
Tax implications can significantly impact real estate investments:
- Dubai: 4% transfer fee (no income or capital gains tax)
- Monaco: 4.5% transfer tax (no capital gains or income tax)
- Paris: Up to 36.2% capital gains tax, plus various other taxes
- Toronto: Up to 67% capital gains tax
Insight: Dubai’s low taxation and absence of capital gains and income taxes make it the most investor-friendly environment.
8. Infrastructure Quality Index
Quality infrastructure contributes to a city’s overall attractiveness:
- Singapore: 95.4
- Hong Kong: 94
- Dubai: 88.5
- Mumbai & Bangkok: Lower scores
Insight: Singapore leads in infrastructure quality, which supports its real estate market’s appeal. Dubai also ranks favorably, reflecting its ongoing development and urban planning.
9. Political Stability Index
Political stability impacts investment security:
- Singapore: 97.7
- Monaco: 94.87
- Sydney: 81.6
- Dubai: 72.8
- Mumbai & Bangkok: Lower scores
Insight: Singapore and Monaco offer high political stability, enhancing their attractiveness as investment destinations. Dubai’s stability is moderate but still favorable compared to other cities.
10. Safety Index
Safety is crucial for investors and residents alike:
- Dubai: 84.4%
- Hong Kong: 78.4%
- New York & Paris: Lower scores
Insight: Dubai is among the safest cities globally, which adds to its appeal as a desirable location for property investment.
Dubai emerges as the top city in our comparative analysis, excelling in multiple categories including price per square foot, rental yield, transaction volume, and safety. Its favorable tax environment, strong infrastructure, and moderate currency depreciation further bolster its attractiveness. For real estate investors, Dubai represents a prime opportunity, showcasing a dynamic market with substantial growth potential and a secure investment climate.
Investors looking for a thriving, high-yield market should consider Dubai, given its comprehensive advantages across the analyzed metrics.